
Numbers to Help You Sleep at Night
One of my favorite observations is that the media has successfully predicted 969 of the last zero calamities. Nowhere is this truer than the financial media. (Electronic) print media is only slightly less inflammatory than TV and video sources, but their goal is the same: keep the investor agitated and tuned in so that advertising sells.
What’s the antidote? For me, it’s the numbers. I much prefer the hard facts to belt-fed opinion. If that sounds good to you, here’s some food for thought:
6.9% is Real
We all (should) know that past performance is no guarantee of future performance. Without a crystal ball, we have to do some fundamental research on companies and/or trust that, as long as capitalism doesn’t go away, future market performance will weather the turbulence and be similar to the past over the decades. If you buy that, then it’s good to keep in mind:
S&P 500 since 1900: 11.85% Average, 10.06 CAGR, but 8.72% and 6.9% adjusted for inflation.
While the S&P 500 index isn’t the entire stock market, it’s been an excellent bell weather and growth engine for over a hundred years. If your financial plan says you need more than 6.9% REAL return to achieve your retirement goals, then you’ve got a different challenge. For most savers, 6.9% REAL return will likely do just fine.
Time in the Market beats Timing the Market
We all know that we should buy low and sell high. But that stupid limbic system in our brain keeps telling us to run whenever the stock market becomes volatile. History repeatedly demonstrates that investors will have far better outcomes if they stay invested through market downturns. A long-term buy-and-hold strategy clobbers market timing. Figure 1 helps drive that home by showing what happens when investors sat on the sidelines waiting for an epiphany about the best time to invest.
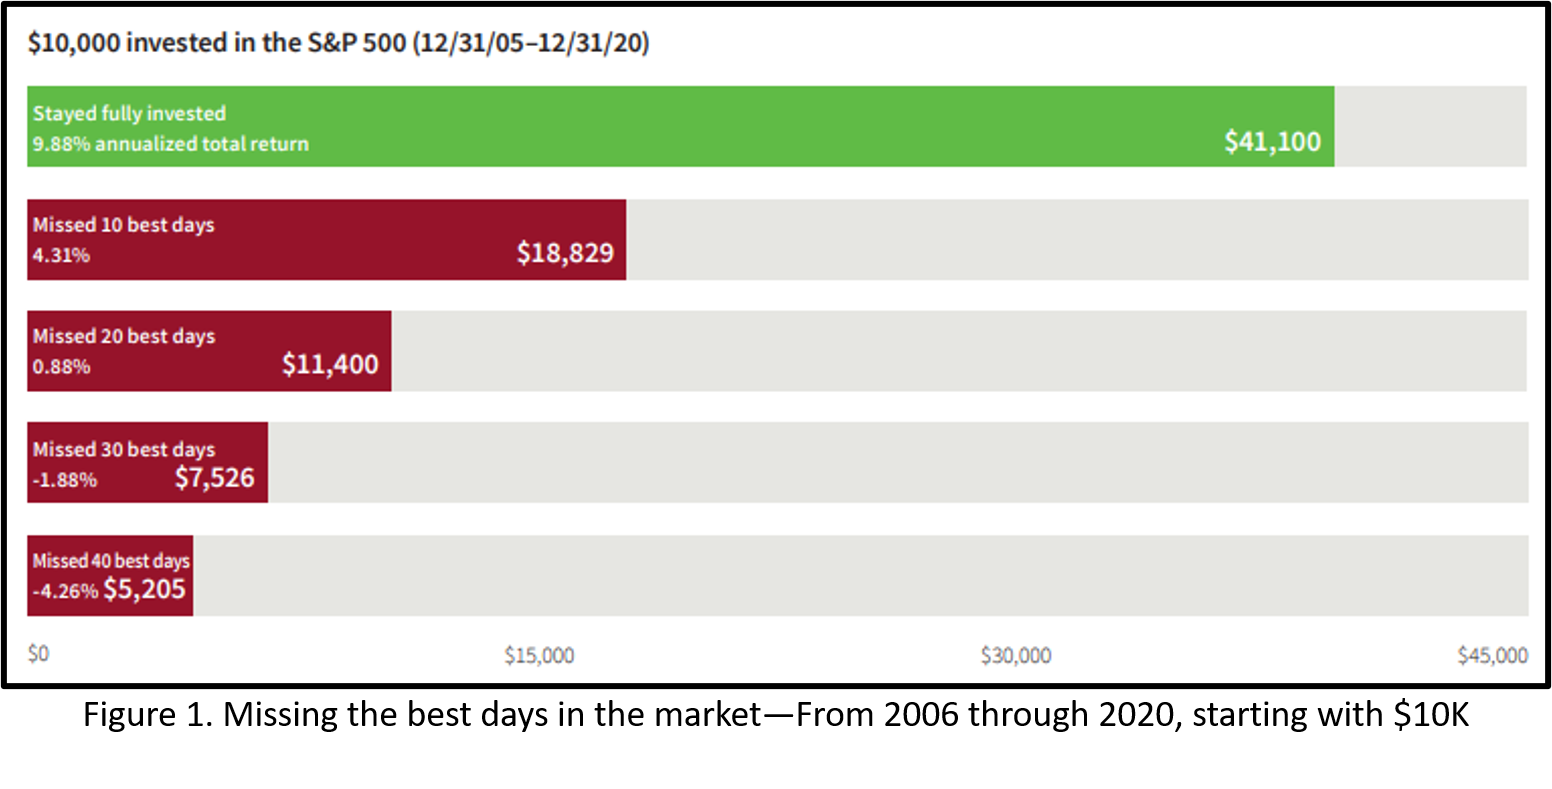
As Warren Buffet says, “The best time to buy is when you have the money and the best time to sell is never.”
The 5-Year Rule
Like all rules in investing, this is not a rule. That said, the 5-year rule says that, if you need your principal preserved (for things like a down payment on a home after military retirement), then don’t put your money in the stock or bond market.
Return of principal becomes more critical than return on principal for specific short-term goals.
Five years is an important number because Figure 2 shows us that historically, there’s an 87.5% chance that the market will be positive over any 5-year period. There is a 12.5% chance of losing principal, and investors must consider that before risking a home purchase, college funding, or another critical purchase.
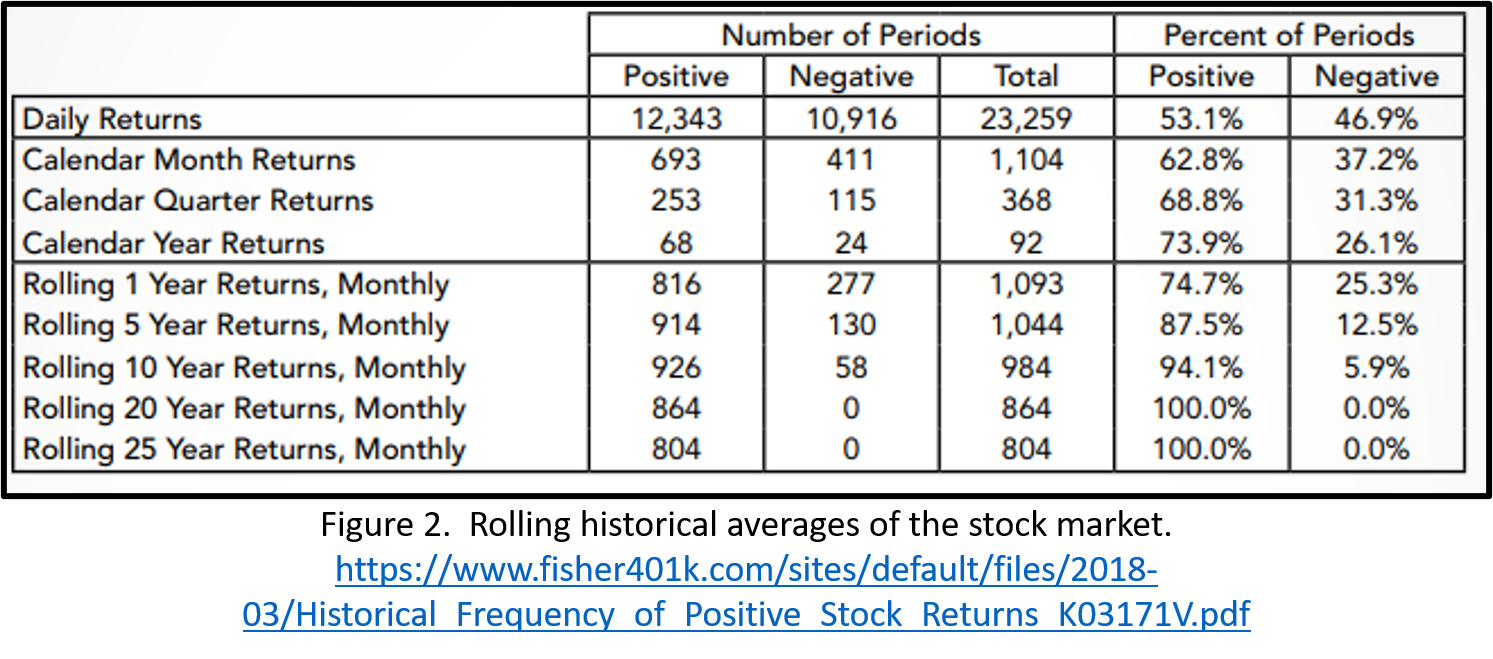
But few of us like leaving gobs of cash sitting on the sidelines for long periods, so the 5-year rule helps frame thinking about how where to put money when a definite need for that money is nigh.
Bulls Beats Bears
A “Bear” market is generally defined by a sustained decline in stock market prices of 20% or more from a recent peak. Bear markets often come with recessions and investor pessimism. Bear markets happen on average every 3.6 years, last about 9.6 months, and have an average decline of 36%.
Figure 3 can give you the sense however, that Bull markets generally last longer and are the norm. Be ready for Bears? Yup. Endure Bears? Yup. But Bulls are the norm that tends to endure.
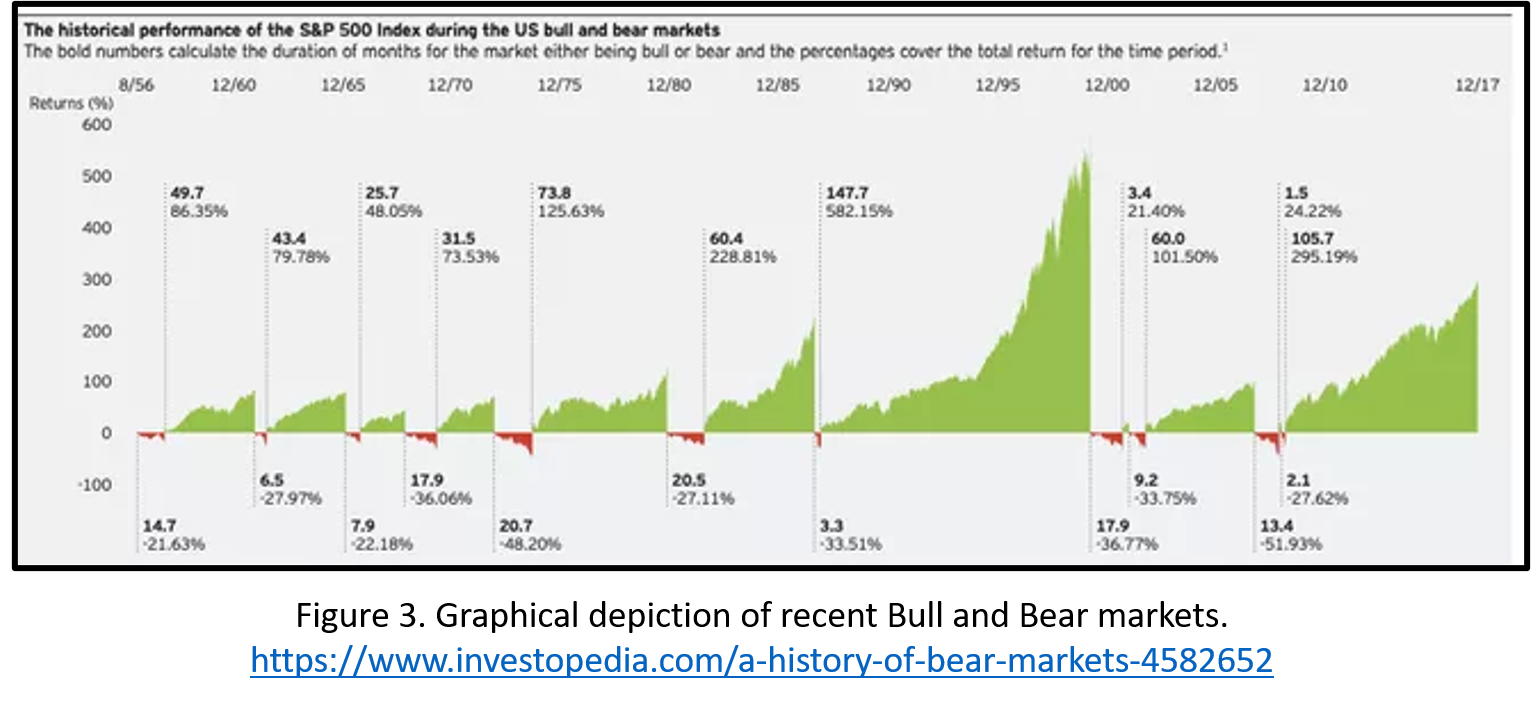
Interestingly, many of the best days in the market occur during Bear markets and the early days of Bull markets—before it’s clear the Bull is on the run.
66% of the Time, it works all the Time
If a Bear market can be thought of as a 20% or greater decline, a 10% decline is usually referred to as a correction. Figure 4 demonstrates that an intra-year decline of 10%, a correction, happens as often as often as every other year, if not more. Corrections are normal, expected, and if you happen to buy at the right time… an opportunity to earn a little extra.
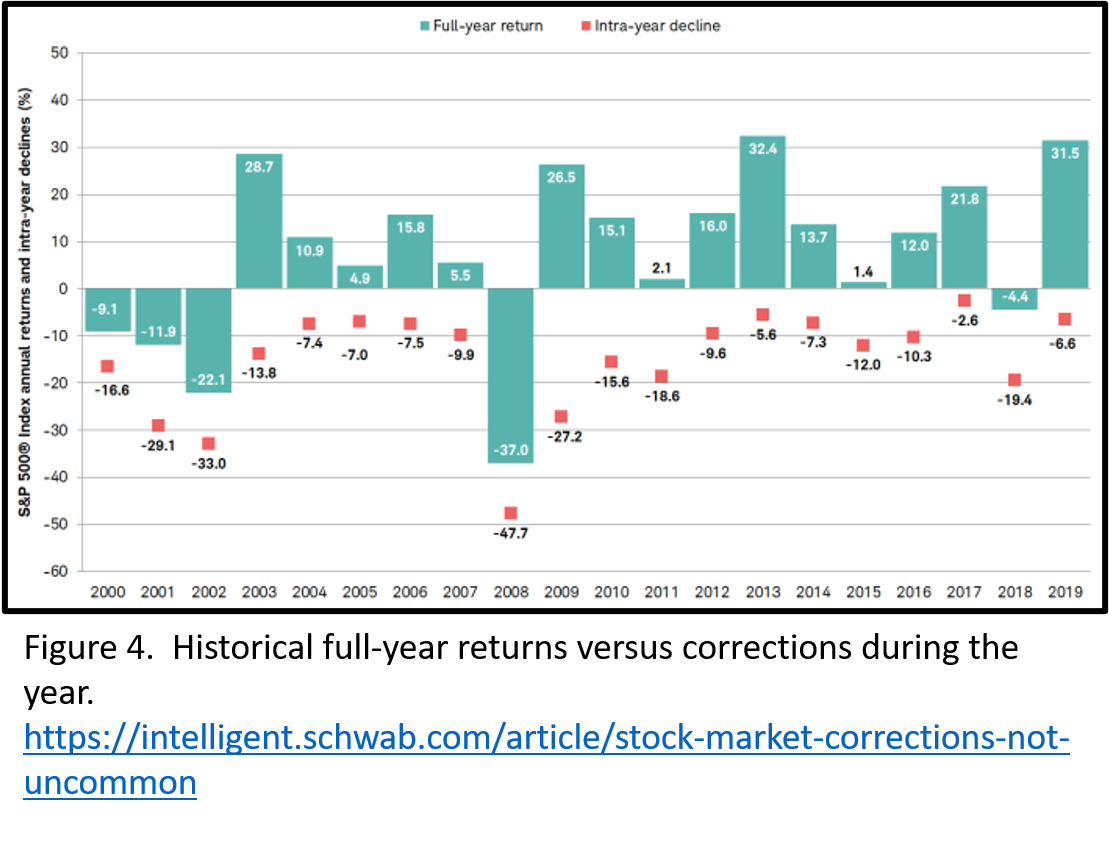
Should you try to find the right time? Nope.
So, You’re Saying There’s a Chance
Hopefully by now, we’re all tracking that the general trend of the stock market is up. We’re in this for the decades, so we should be most interested in the general trend, not the daily trend.
Figure 5 lays out the odds that the stock market (or at least the Dow Jones Industrial Average) will be up in a given year based on conditions. This isn’t information I’d make snap decisions based upon. But it should provide comfort in volatile times.
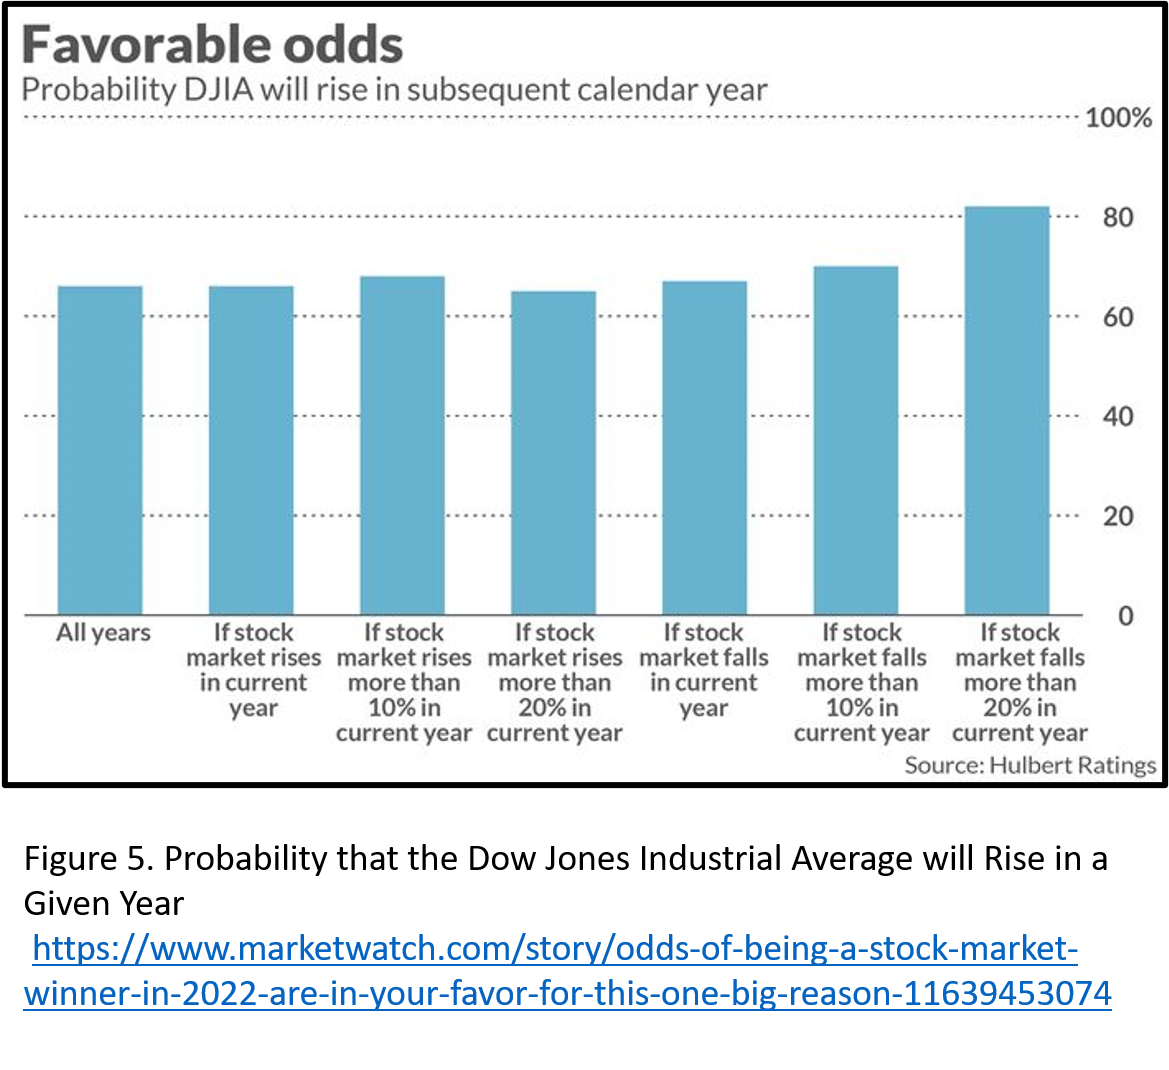
The take away? Over 60% of the time, the market has been up. After a bad year, the odds have gone up to over 80%.
Cleared to Rejoin
This article isn’t meant to be a Pollyanna-ish call for unbridled optimism. But the reality is that our stock markets generally trend up. Volatility, including corrections and bear markets is a feature, not a bug. We’re going to have down years. Sometimes we’ll have many in a row. Keeping the historical numbers in mind can help us stay the course… and hopefully sleep at night!
Fight’s On!
Winged Wealth Management and Financial Planning LLC (WWMFP) is a registered investment advisor offering advisory services in the State of Florida and in other jurisdictions where exempted. Registration does not imply a certain level of skill or training.
This communication is for informational purposes only and is not intended as tax, accounting or legal advice, as an offer or solicitation of an offer to buy or sell, or as an endorsement of any company, security, fund, or other securities or non-securities offering. This communication should not be relied upon as the sole factor in an investment making decision.
Past performance is no indication of future results. Investment in securities involves significant risk and has the potential for partial or complete loss of funds invested. It should not be assumed that any recommendations made will be profitable or equal the performance noted in this publication.
The information herein is provided “AS IS” and without warranties of any kind either express or implied. To the fullest extent permissible pursuant to applicable laws, Winged Wealth Management and Financial Planning (referred to as “WWMFP”) disclaims all warranties, express or implied, including, but not limited to, implied warranties of merchantability, non-infringement, and suitability for a particular purpose.
All opinions and estimates constitute WWMFP’s judgement as of the date of this communication and are subject to change without notice. WWMFP does not warrant that the information will be free from error. The information should not be relied upon for purposes of transacting securities or other investments. Your use of the information is at your sole risk. Under no circumstances shall WWMFP be liable for any direct, indirect, special or consequential damages that result from the use of, or the inability to use, the information provided herein, even if WWMFP or a WWMFP authorized representative has been advised of the possibility of such damages. Information contained herein should not be considered a solicitation to buy, an offer to sell, or a recommendation of any security in any jurisdiction where such offer, solicitation, or recommendation would be unlawful or unauthorized.